

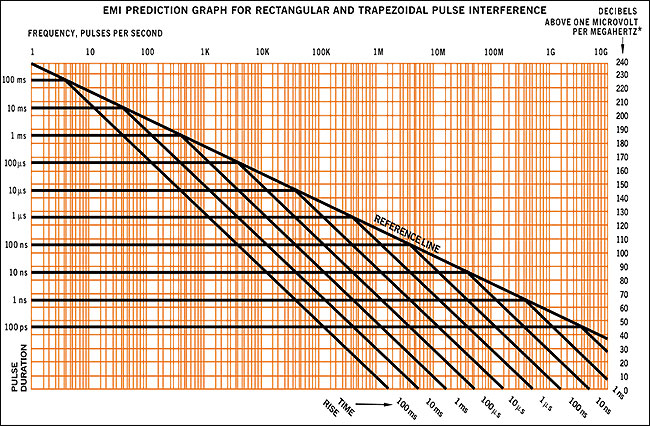
EMI Prediction Graphfor rectangular and trapezoidal pulse interference |
 |
||||
|
|
FOURIER PREDICTION OF EMI ENVELOPE Work from right to left. Find the sloping line which represents rise time and follow it up to intersect with the basic reference line. Follow the reference line up to intersect with the horizontal line representing the duration of the pulse. Follow the horizontal line to the left to the lowest frequency of interest. For transient or "worst case" when pulse information is not available, use the basic reference line to define the EMI envelope. For EMI voltage* levels, read the right edge for dB above 1 µV per MHz bandwidth. For voltages other than 1 V*, find the number of dB equivalent to 20 times the log of the new voltage. Add this number of dB to the right hand scale. |
|
|
|
|